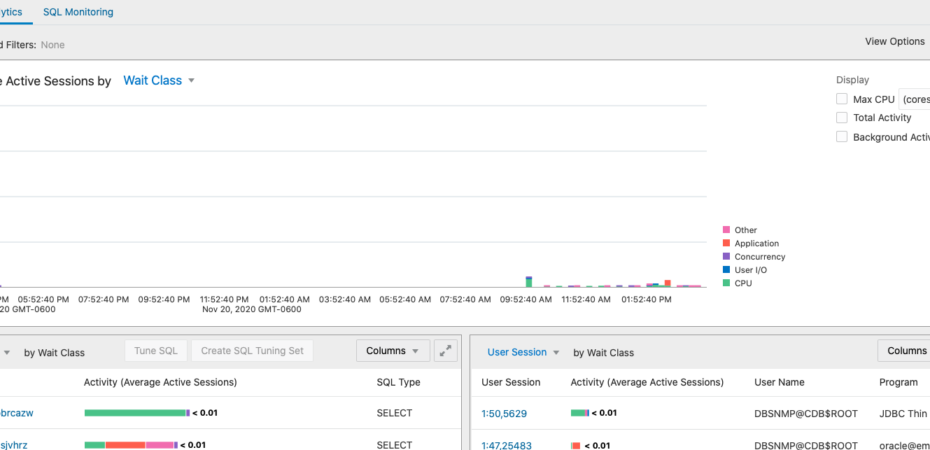
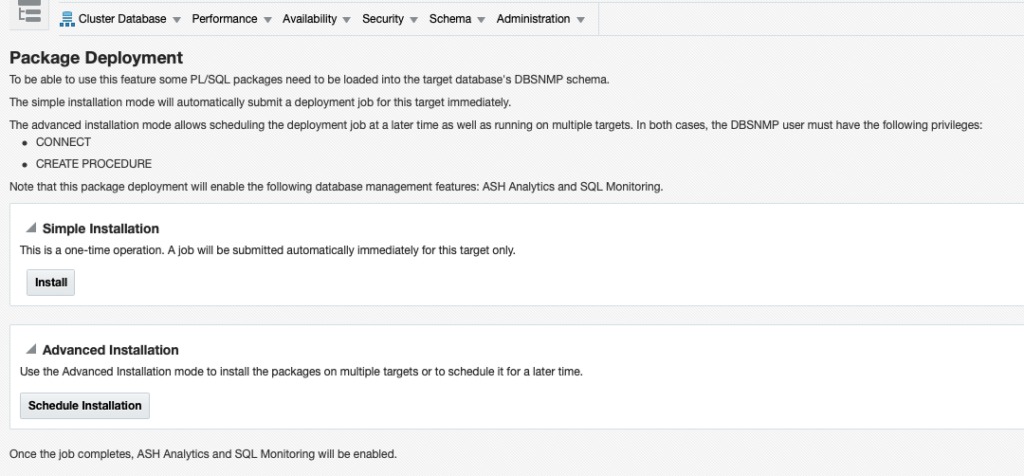
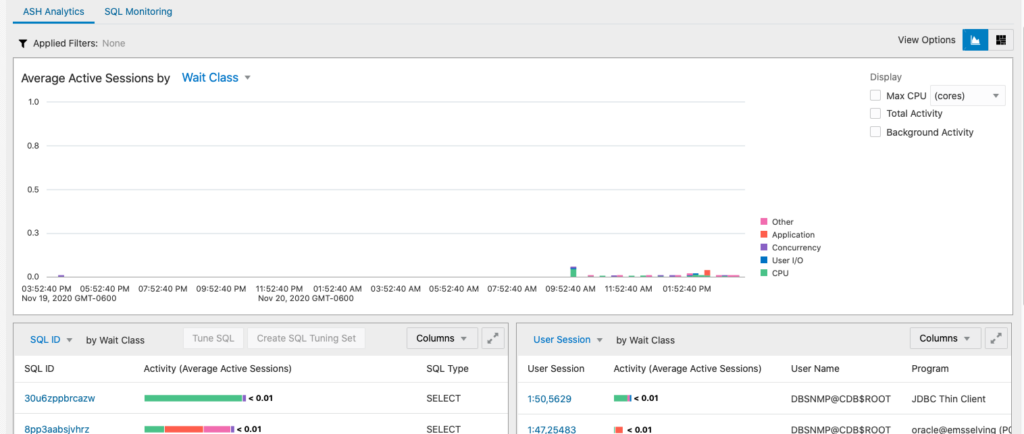
With Flash being deprecated this year, many people are upgrading to Oracle Enterprise Manager (OEM) 13.4 and converting over to using the Perfhub tools instead of the older Top Activity (many still kicking and screaming as they go). A few of my customers have noticed that some of their users are running into a permissions issue when they try to use ASH Analytics or SQL Monitoring under Perfhub. To enable the agent to access the underlying database packages, there’s a package script that has to be run to grant access to the monitoring user (typically DBSNMP) so that the pages can be viewed properly. OEM provides you with a message and instructions on how to run this script as a job through OEM. However there may be cases where the application DBAs don’t have the right privileges to run jobs, or don’t have the credentials needed.
Of course, there’s an easy solution for this because Oracle provided a library job called Deploy Database Management PL/SQL Packages which will do this for you, and use the monitoring user credentials. So as long as you have connect and create job privileges on the target, you can submit a mass job to run the appropriate ASH package scripts. This is documented in MOS note 2580773.1.
Should be easy right? Well one of my customers came to me and said, we did that across 5k databases, but we don’t really know which ones worked or failed for some reason, and we can’t always remember to run this when a new DB is created and we don’t know about it. They needed a way to automate validating the right packages existed, and then if not submit the right job to execute. So on a relatively meeting free day, I had some time to play around with it using 2 of the very under utilized features of OEM: Metric Extensions and Corrective Actions.
Create a Metric Extension to Check for ASH Packages
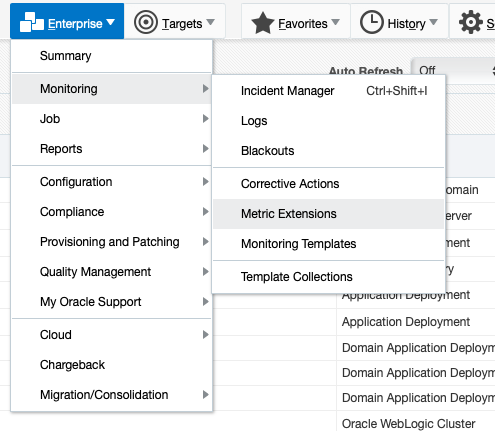
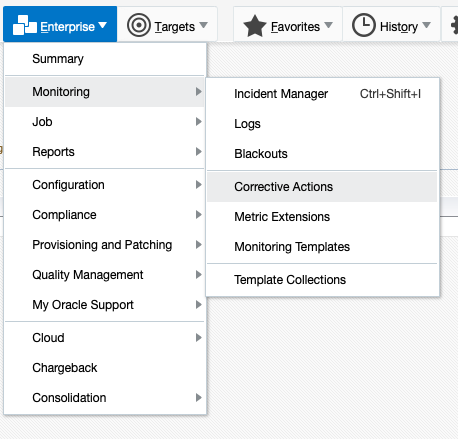
Start by creating a Metric Extension to collect the information we need to decide if we have a problem or not. From the main OEM menu, select Monitoring > Metric Extensions.
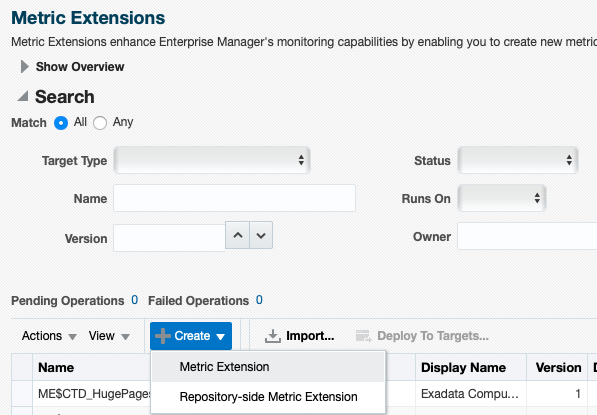
Select Create > Metric Extension. This will allow us to create a metric and deploy it to run at an agent just like an out of box metric. Repository-side metric extensions are only executed on data within the repository and can be used to aggregate data or perform calculations. For more information on Repository-side Metric Extensions see the Oracle documentation.
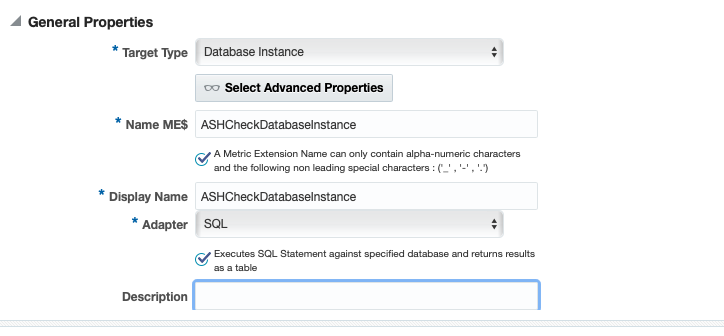
Select the Target Type to Database Instance, provide a name for the Metric Extension, and set Adapter to SQL.
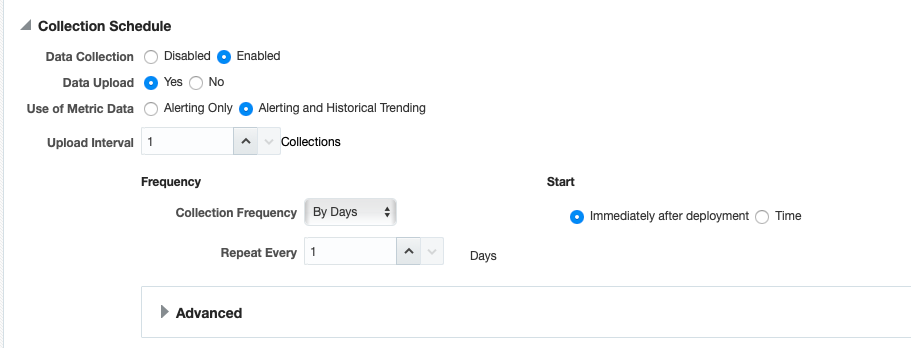
We don’t need to run this metric very frequently. You could run it every 24 hrs, or if you don’t add databases very frequently, you could even run it once a week. Set your desired schedule and click next.
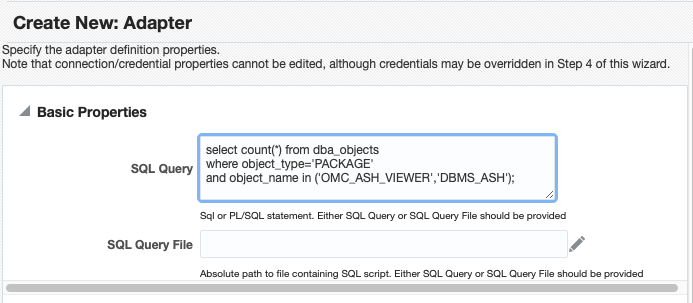
Next we will provide the SQL query we want to run to collect this metric. You must write the query so that it returns exactly the data you need. In this case, all I want is to see a count of packages with names OMC_ASH_VIEWER or DBMS_ASH. Add the query and click next.
select count(*) from dba_objects
where object_type='PACKAGE' and object_name in ('OMC_ASH_VIEWER','DBMS_ASH');
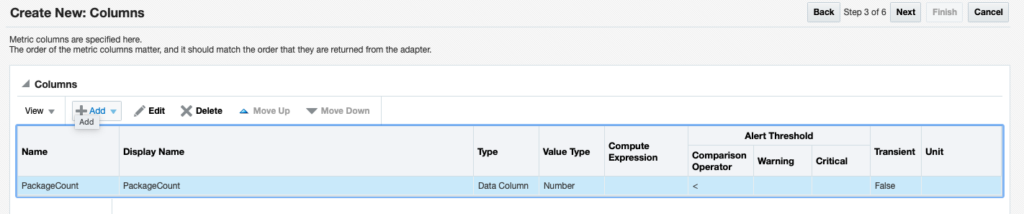
Now click Add to add a column to store the data collected by the metric. Give the column a name such as PackageCount. Since we’re not collecting multiple rows, it will just be a Data Column, and it will be a Number type. Set the Comparison Operator to < so that you can set alerts when there are 0 packages.
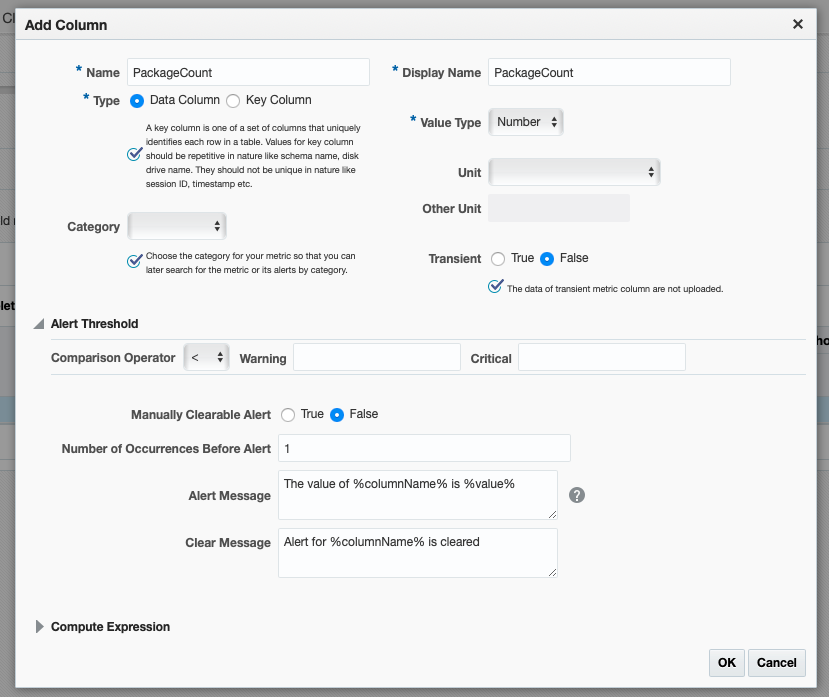
Save the column and click next.
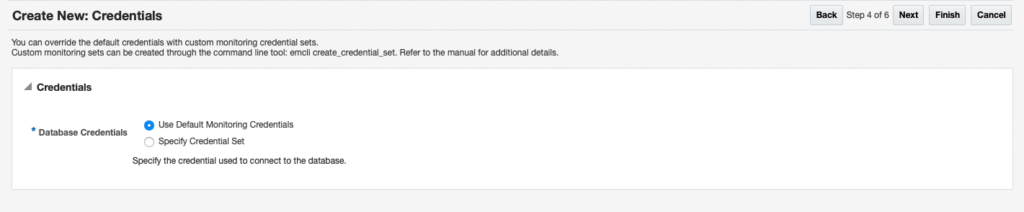
Use the default monitoring credentials, and click next.
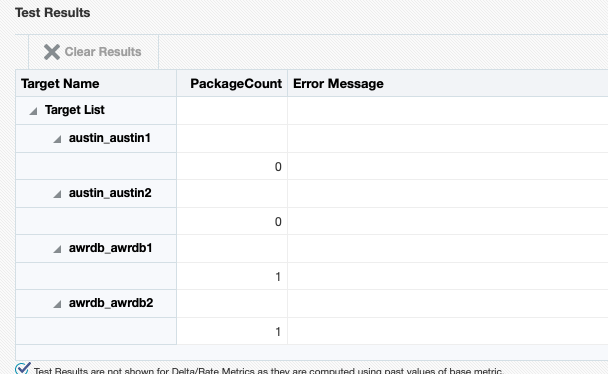
Test the metric extension by selecting a few databases, and validate the results. You can edit the metric at this point if you need to.
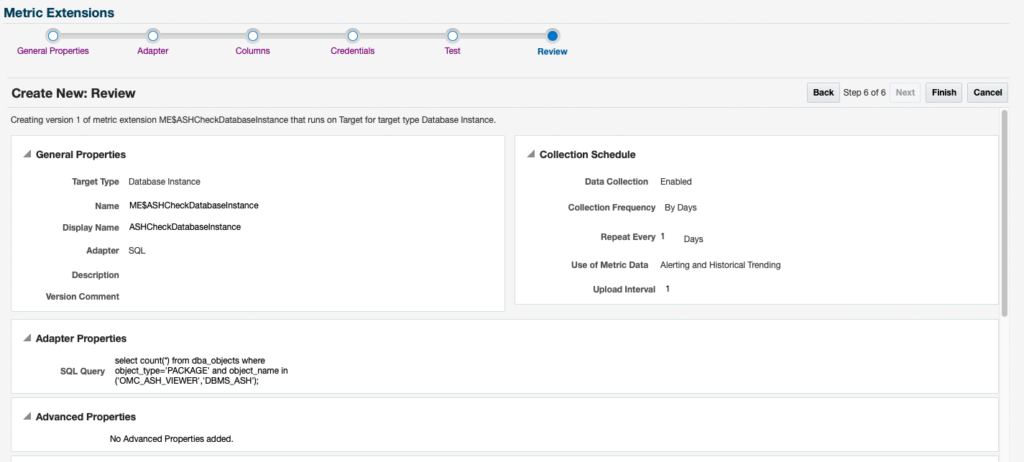
Review the metric extension as necessary and click Finish. Once you’re satisfied with your metric, save as a Deployable Draft, and finally Publish the metric extension. You’ll need to repeat this for Database Instance and Pluggable as they are all executed individually. Technically, you would want to run it on a cluster database and not the instances, but since it won’t hurt to run it against both instances of a cluster, I’m going to take the short cut and stick with Database Instance and Pluggables. We will deploy this to the targets in a later step using Monitoring Templates.
Create a Corrective Action to Remediate the Issue
Corrective Actions are very powerful, yet few people take the time to create them and put them into action. A corrective action is associated to a metric, and then when a metric triggers an alert, you can have it anatomically kick off the corrective action to resolve the issue or take further steps. Creating a Corrective Action to execute the library job is as easy as it gets.
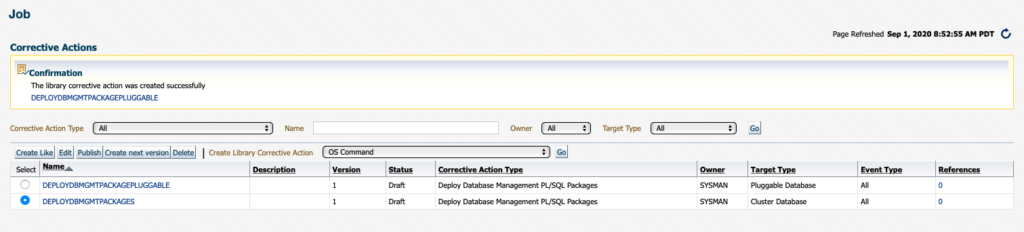
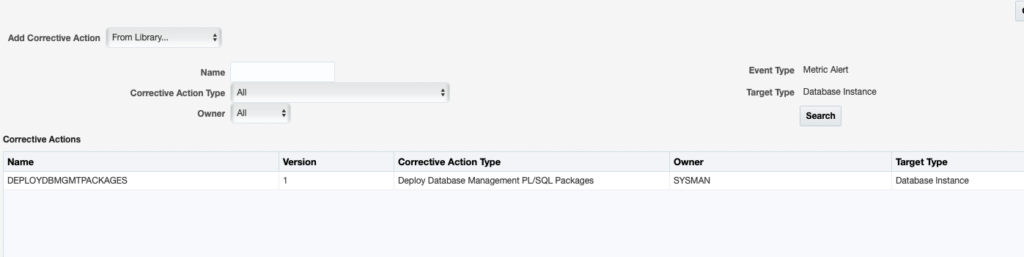
Go to Monitoring > Corrective Actions.
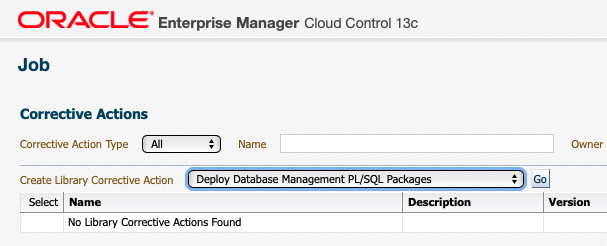
Select the Deploy Database Management PL/SQL Packages job from the dropdown menu and click Go.
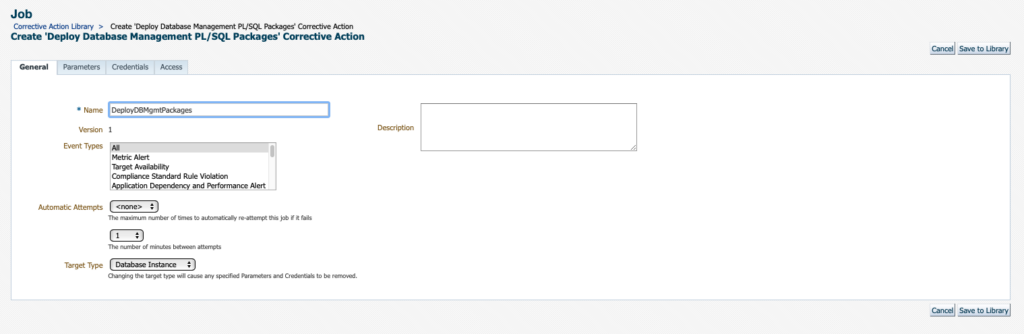
Give the Corrective Action a name and set Target Type to Database Instance.
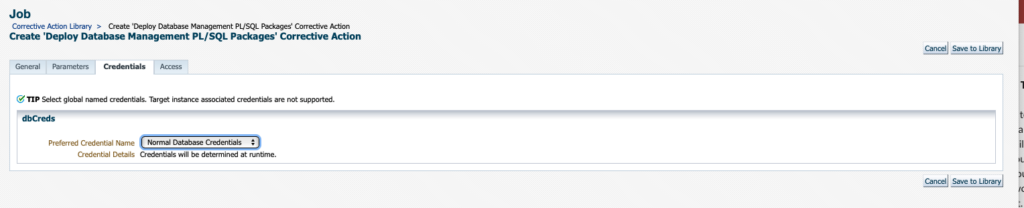
Accept the defaults and use the normal database credentials.
Click Save to Library to save the corrective action job to your library. Select the corrective action and select Publish to make this executable. This will need to be repeated for each target type just as the Metric Extension was done (Cluster Database, Database Instance and Pluggable).
Add Metric Extension and Corrective Action to Template
The next step is to add the Metric Extension and Corrective Action to your templates so that they can be deployed to all your databases consistently. If you only want to run this on a few, you can manually deploy the metric extension and set the corrective action in that particular target.
Go to Monitoring > Monitoring Templates, select your template and click Edit. Click on the Add Metric button.
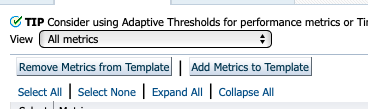
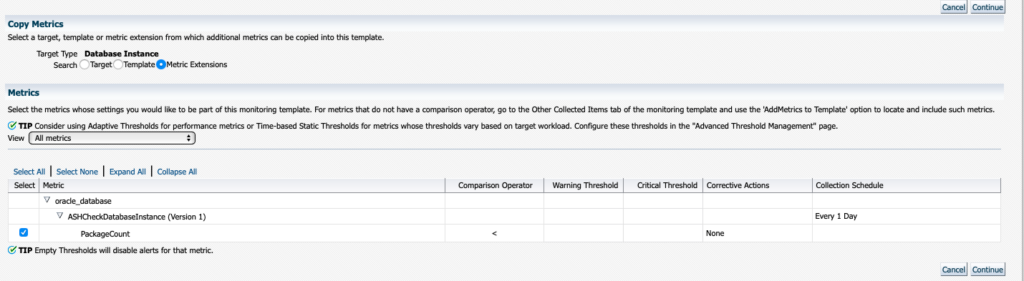
Search for Metric Extensions and select the appropriate metric extension you created before and click Select.
Find the newly added metric in your template, and click the Edit button (the glasses).

Click add for either Warning or Critical. You’ll want to leave the Allow only one corrective… option checked. This will prevent more than one run of this job.
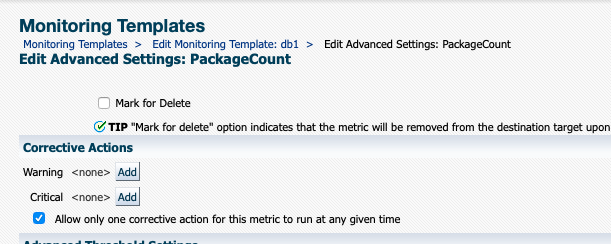
Select the corrective action that you created earlier.
Click Save and validate that your metric collection now has a Corrective Action (shown here as Warning Only). Add a threshold of 1 in the Warning column. Click Save to save the template.

Next step would be to apply to all your database targets. When your database runs the metric extension check, if there are no appropriate packages it will trigger a warning Alert, and immediately fire the corrective action, which will then schedule the deployment job.
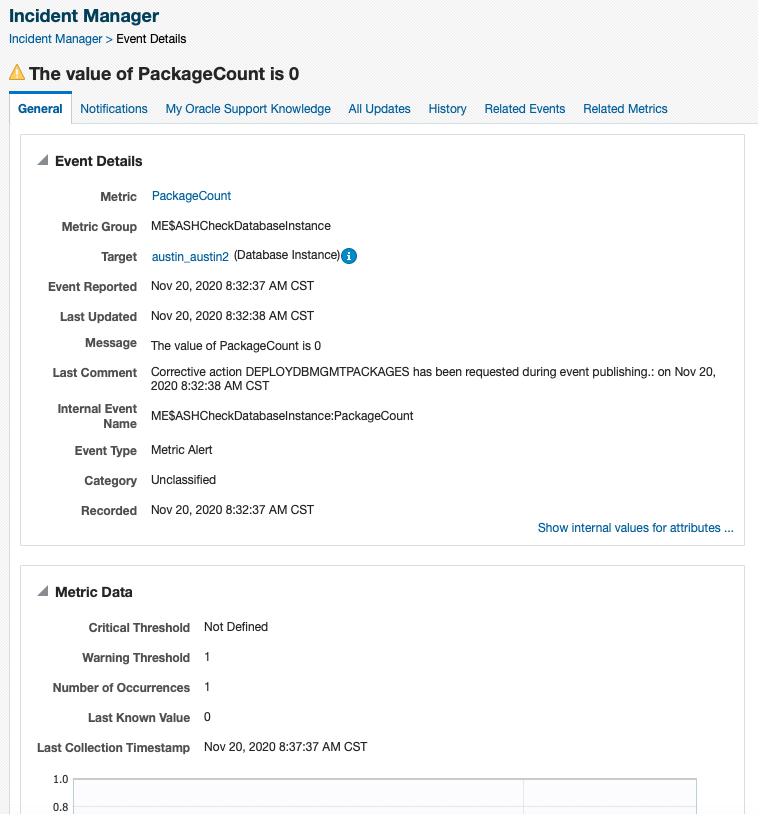
Once the Corrective Action runs successfully and the metric collects again, the alert will clear. This should only have to happen once for each database, but it will help stay on top of new databases that may be added without these permissions.
Summary
In this use case, I’m just applying the standard monitoring features that Oracle Enterprise Manager provides to resolve access issues for database performance tuning; however this solution could be applied to almost anything in the database or host. There are many out of the box corrective action jobs that are well worth taking a look!