One of the most critical steps in monitoring your targets with Enterprise Manager, is to set your metrics and thresholds properly for your environment. All targets will have predefined metrics that will be enabled and thresholds set based on recommendations from Oracle product teams. These may or may not be good for your environment. Customers all have different requirements for what they want to be e-mailed, paged or notified by ticket about.
The most common metrics for databases are going to be the ones that cause service outages: availability, space issues, archiver issues, data guard gaps, critical ORA- errors. Some things, you just don’t need to know about at 2am though, things like global cache blocks lost.
From the target menu, select Monitoring / Metric and Collection Settings. This will show you the current settings of your target. Notice the default view is Metrics with Thresholds. Other items are collected and can be seeing in the All Metrics view.
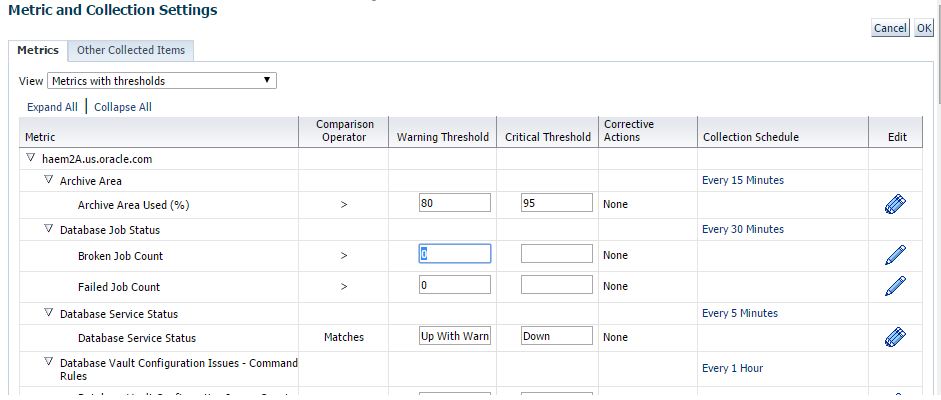
Let’s take a closer look at what we see here. First we have the metric grouping or category. Then for each metric in the group, you’ll have the operator, warning and critical thresholds. These are the most important. If you don’t provide a value, alerts will not be triggered as there will be no threshold violations. The next column displays if a corrective action job has been registered on this metric. Followed by the collection schedule and Edit icon.
Clicking on the link in Collection Schedule will bring you to the collection settings. You can enable or disable a metric collection, change the frequency, and determine whether alert only or historical trending data will be saved. If you select alert only, it will only store occurrences where thresholds are violated. Pay careful attention to the Affected Metrics section, as some metrics are collected in a group, and modifying these settings will affect all metrics in that group.

Returning to the main screen, click on the pencil icon to edit the metric.
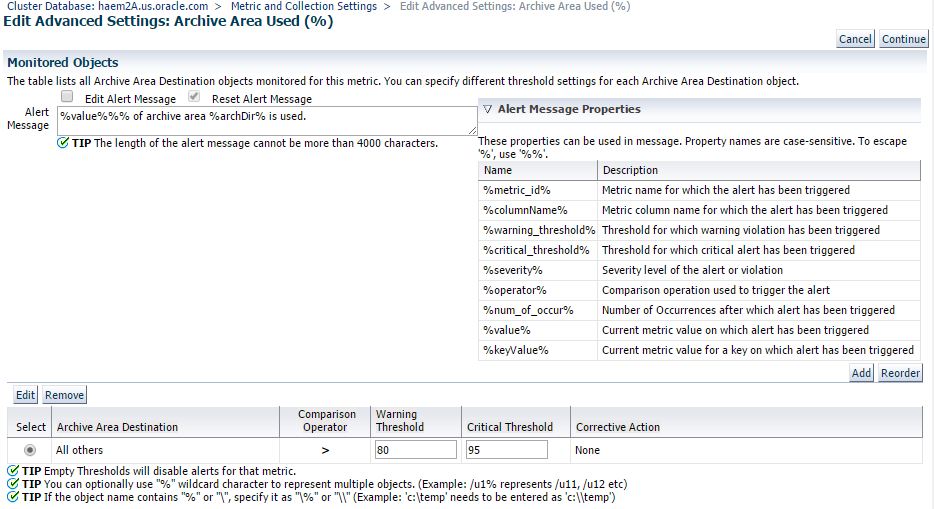
This first section is where you can add a Corrective Action job if you want to automatically fix your alerts. An example would be kicking off a RMAN archive log backup job when Archive Area Used % event is triggered.
In the Advanced Threshold section, you can determine how many times a threshold must be exceeded in a row to trigger an alert. So if you want to alert if CPU is 95% for over 3 collections (15 minutes), then you would set Number of Occurrences to 3.
Template override allows an administrator to prevent a particular metric from being changed when templates are applied. You want to avoid this as a common practice and reserve for special exceptions.
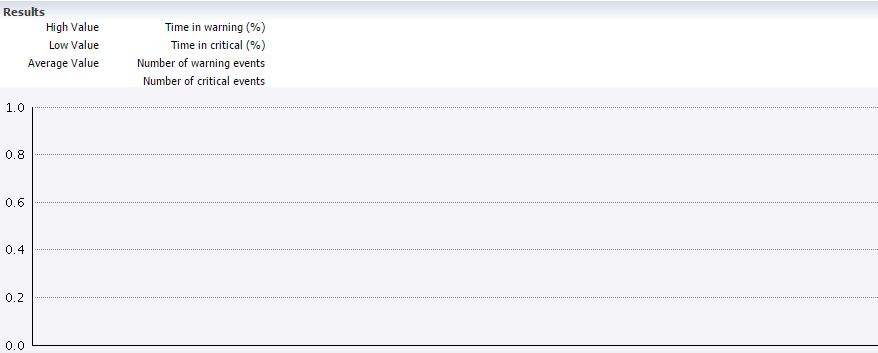
The Threshold Suggestion section allows you to evaluate what warning and critical severity alerts would be generated if you changed thresholds. You can look at the last month of collected metrics to make the best threshold estimates. 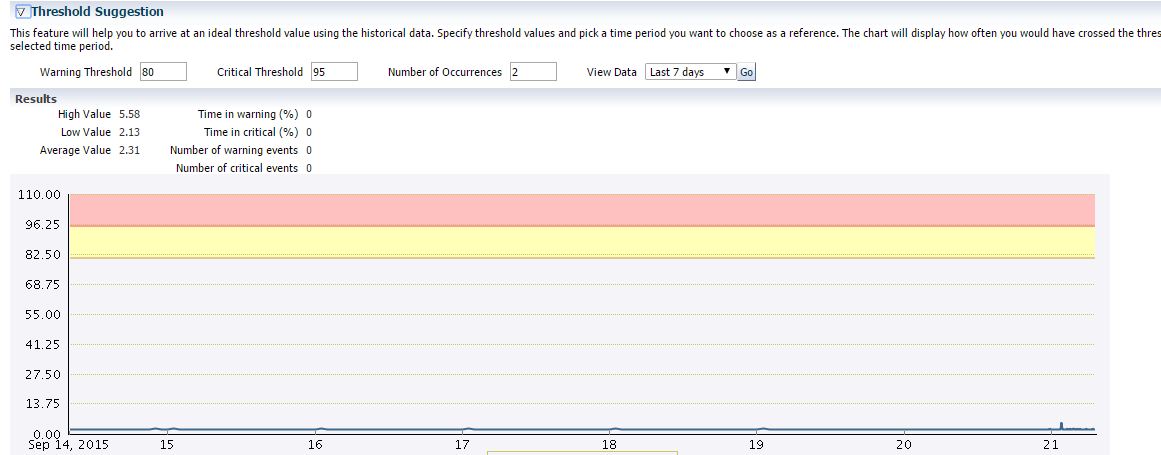
If your metric has multiple keys, you will have an additional screen where you can add additional keys. A key would be a filesystem, or a tablespace that you want to monitor with different thresholds then the rest.
Whey you’re finished making changes, clicking Continue and OK to save metric changes to the repository and push out to the Agent. Once you get a target set up for monitoring the way you want, you can create a template to push the same settings to all like targets. I’ll cover this in another post soon!