Every target in Enterprise Manager has a set of target related metrics. These metrics control what is collected, how frequently, and whether alerts and notifications are sent. They are defined by target metadata and are specific to a particular target type. The metric is collected by the Agent on regular intervals, and then batch uploaded to the EM repository. Exploring these collected metrics can provide you with a wealth of information about your target.
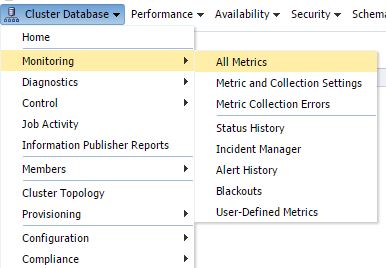
From the target, click the target menu / Monitoring / All Metrics.
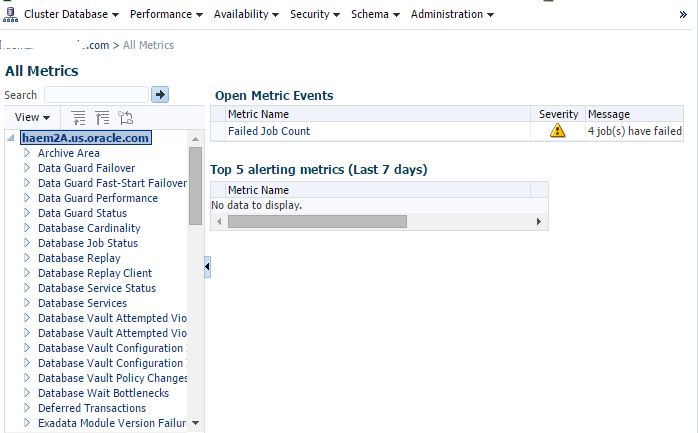
In this view you will get all possible metrics for this target. You’ll also see a list of the Open Metric Events (a metric that has crossed a threshold), and the top 5 events over the last 7 days.
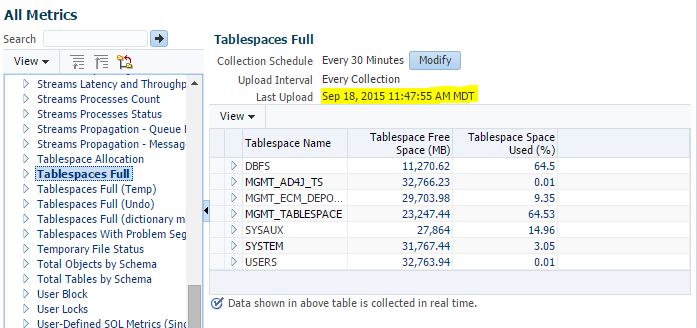
If you click on a metric category on the left, you’ll get the real-time values of those metrics. The Last Upload is telling you when these metrics were last collected and uploaded to the repository.
To see those values, expand the category by clicking on the ![]() and selecting a specific metric, in this example Tablespace Space Used %.
and selecting a specific metric, in this example Tablespace Space Used %.
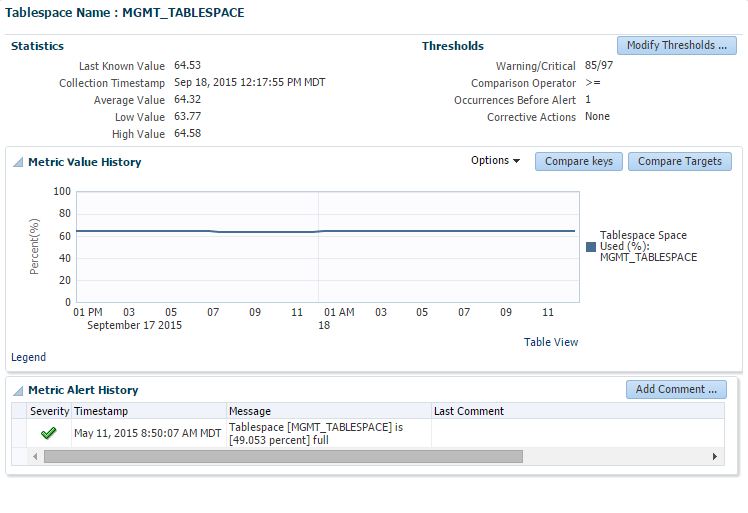
This view is now showing you the last collection, by tablespace with average, low, high and last known values. You will see the severity is clear for all tablespaces at this time. If you have an open event, you may see a warning or critical icon here. When you select an individual tablespace, a chart will appear in the lower half of the screen.
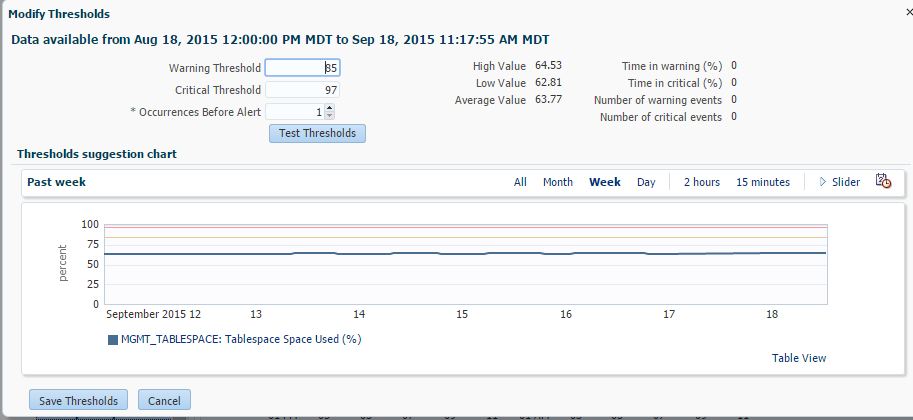
In this lower section, you can do a variety of actions. At the top you’ll see a summary of the metric data, as well as the option to Modify Thresholds. Thresholds saved will be sent out to the agent for changes.
If you want to see the metrics in table view to see the exact values and timestamps over the last several days, click the Table View link.
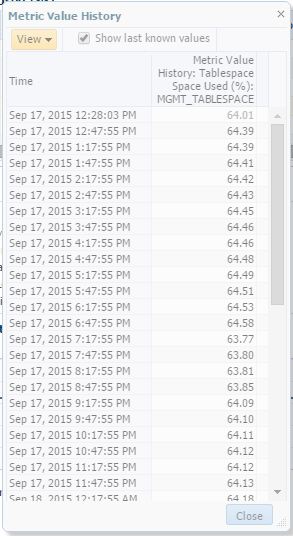
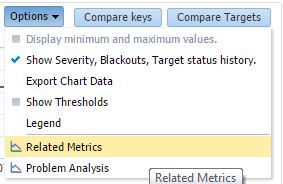
Under Options, you can also export this metric data to a CSV file. Or maybe you want to see related metrics or problem analysis to identify what might have caused an issue with this metric.
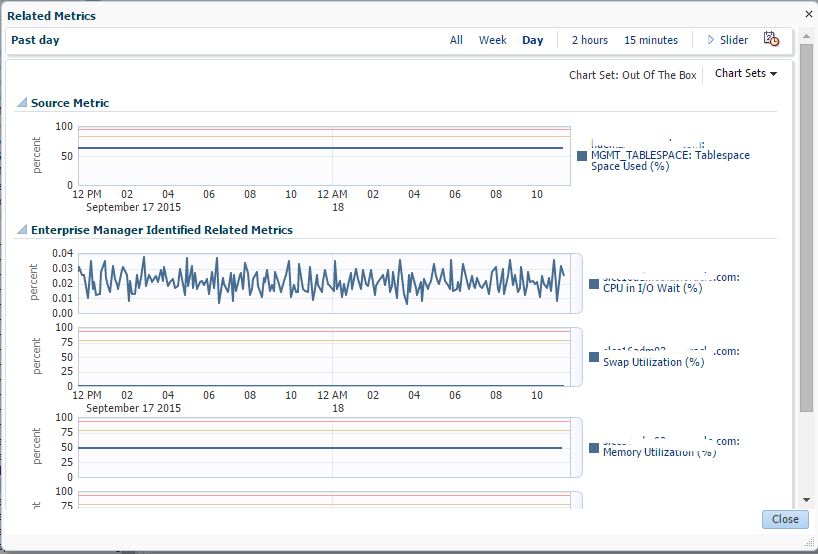
When viewing Related Metrics, the predefined related metrics will be displayed, but you can add your own from any targets.
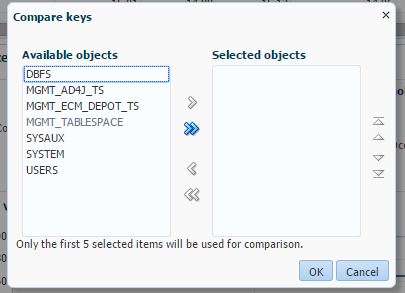
Additionally, you can compare to other keys, which would be other tablespaces in this example. Or you can compare to other targets, say if you wanted to compare CPU utilization on 2 hosts.
By default, the data is show for a 24 hour period. Options to view 7 days, 31 days, and custom time periods are also available.
There’s a wealth of information collected and stored, and the best place to start looking at it is in the All Metrics view. This can help you identify collection category, additional metrics you might be interested in, and patters and trends on alerts.
