I know it’s been a while since I’ve blogged about anything, but I have good reason! I’ve been busy working with a new service offering that Oracle has launched, called Oracle Management Cloud. I gave a quick glimpse earlier this year of the three services that were launched – Log Analytics, Application Performance Monitoring and IT Analytics. Since then we’ve also added Infrastructure Monitoring. Right now, I’m going to talk a little more about Log Analytics and how you can get started using it.
Log Analytics
From application managers to system admins to DBAs, we all have to look at log files. If you have multiple servers, it can take hours to gather all the relevant logs and comb through them, correlating times and searching for error messages. Log Analytics can make this process simpler and automated. By loading all related log files to the Oracle Cloud, you can search through logs from multiple targets, and store terabytes of data. Gone are the days of being approached by someone weeks after an issue happened and asked for another log file only to find out that the logs have rolled over already.
The beauty of Log Analytics is that instead of making you create all your own parsers and log sources, Oracle has provided some very common parsers and sources out-of-the-box. This list continues to grow every month. You can get started immediately for Oracle Database (including audit, trace alert, listener, asm), WebLogic, Tomcat, Windows Events, Linux, Solaris, Apache and more. But what if you have another product, like LifeRay portal supporting your PeopleSoft application that you want to collect logs for? Easy. Log Analytics is very flexible and allows you to create a new parser specific to any kind of log you want to read and pull that data in alongside your other logs for quick analysis and troubleshooting.
Getting to Know Log Analytics
Let’s breakdown the Log Analytics page and take a look at what we can do. At the top we have our search bar which allows us to search using keywords and phrases. It also shows you the recent searches when you click in the search bar, so you can select one from your history and rerun it. To the right, you have options to Save, Open and Configure. Save allows you to save your search as a custom widget. This can be added in a dashboard, we’ll talk more about that later. Open allows you to open a previously saved search. Configure takes you to the configuration options for log sources and parsers. We’ll talk about this more in another blog. The Run button executes your search.
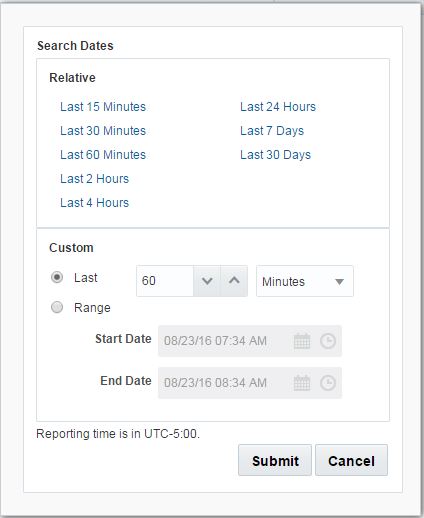
Also in this section you have the time selector. This window expands to give you many pre-defined time windows, or allow for a custom time window.
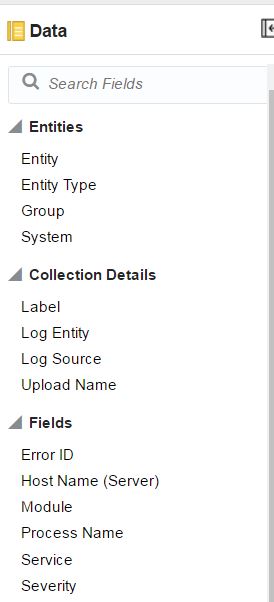
The Data panel on the left has all the properties and fields.
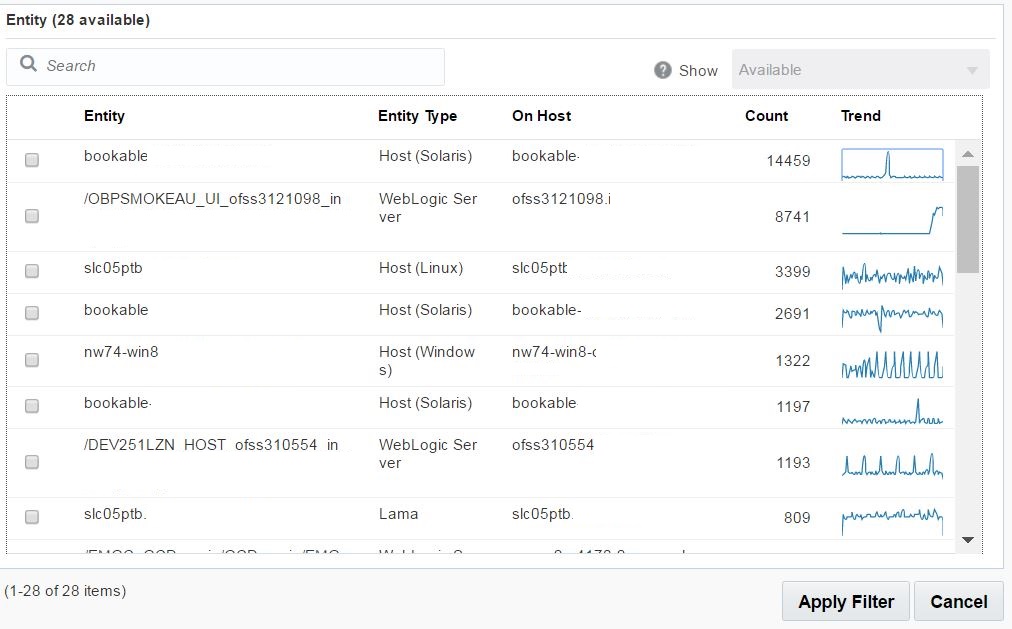
We can filter on any of these fields to find a specific entity type, entity, severity or error ID. You can also filter on Groups or Systems (created within OMC or imported from Oracle Enterprise Manager). When you click on one of the fields, you’ll be presented with the list of entries, as well as a chart that shows the trend of logs associated with that entry over the time period you have selected.
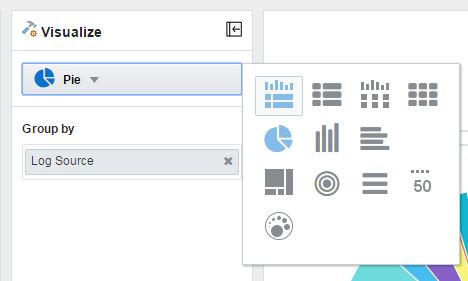
The Visualize panel allows us specify which fields and how we want to view the data. Pie chart, records with a histogram, heat map, tile, sunburst… An option for any type of query.
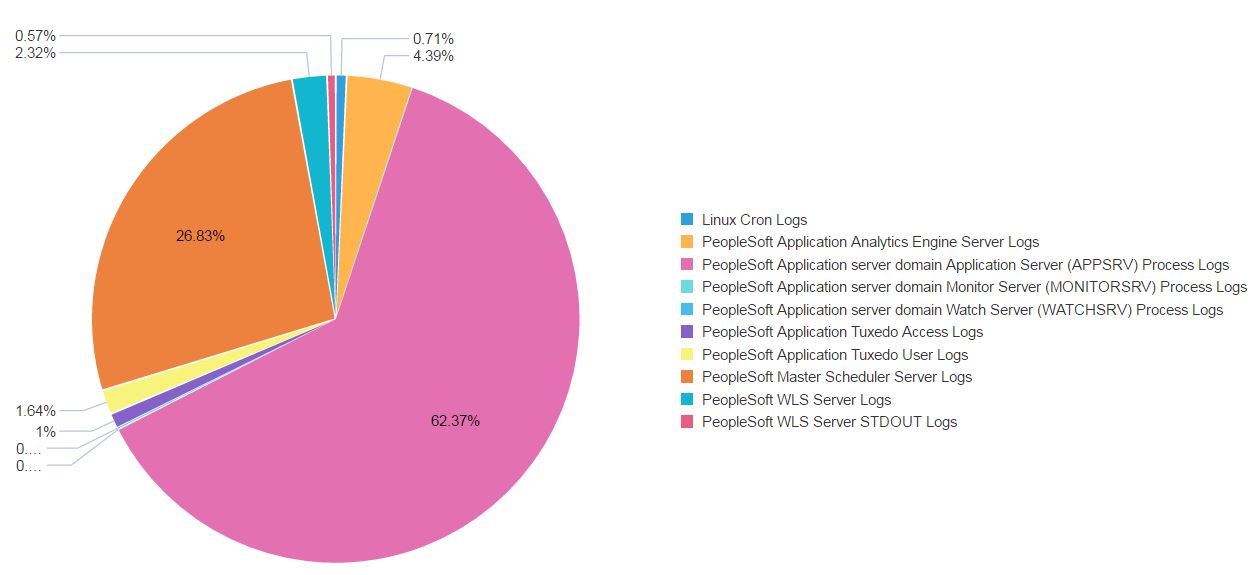
Then you have your chart. By default you’ll see a pie chart of logs by log source over the last 60 minutes.
Putting it to Work
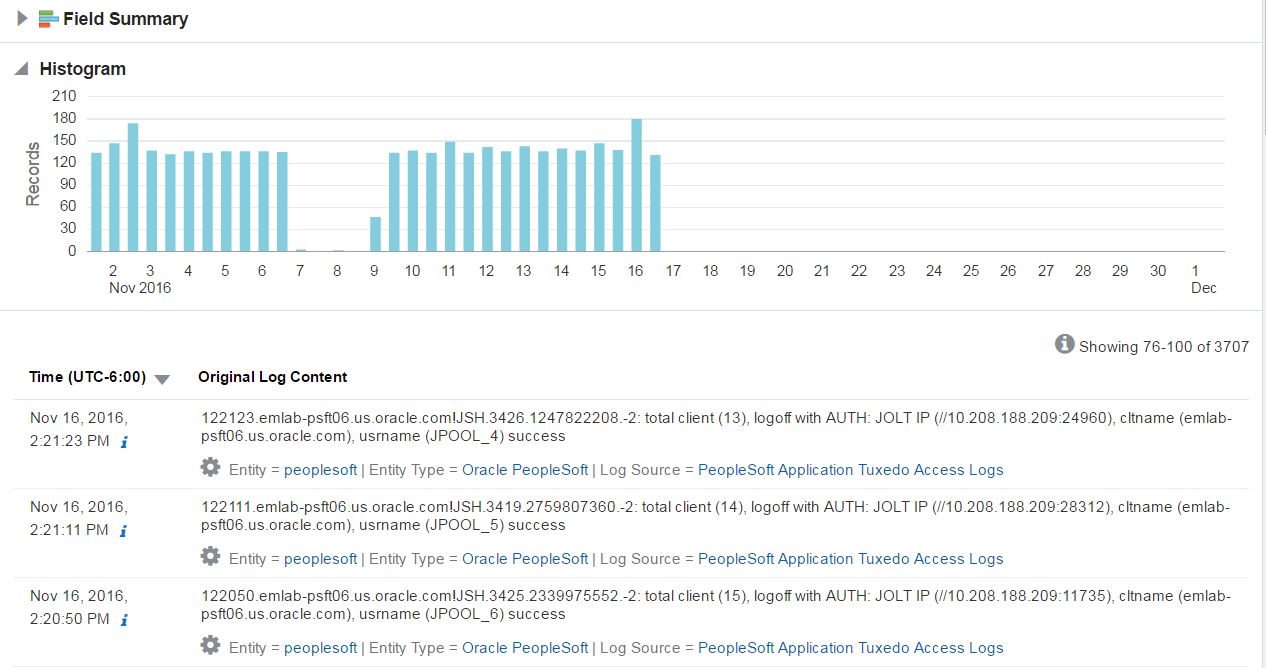
Now that we’ve talked about the layout and features of Log Analytics, let’s take a look at some of the ways we can use our log files. If we select a certain type of logs, let’s say PeopleSoft Application Tuxedo Access Logs (shown here), and with a couple of clicks drill down, we’re presented with the histogram view of this particular log type, and a time sequence of the entire set of associated log files. From here I can continue to drill down or filter based on specific fields or time.
One thing that’s important to note in the picture above, is that all timestamps are normalized to UTC. This can be a great help when you’re consolidating logs from different applications and servers across the globe that have different timezones. With all log files automatically consolidated and aligned in time-order, I can now see for example, when someone logged in and changed permissions or my transaction rate dropped.
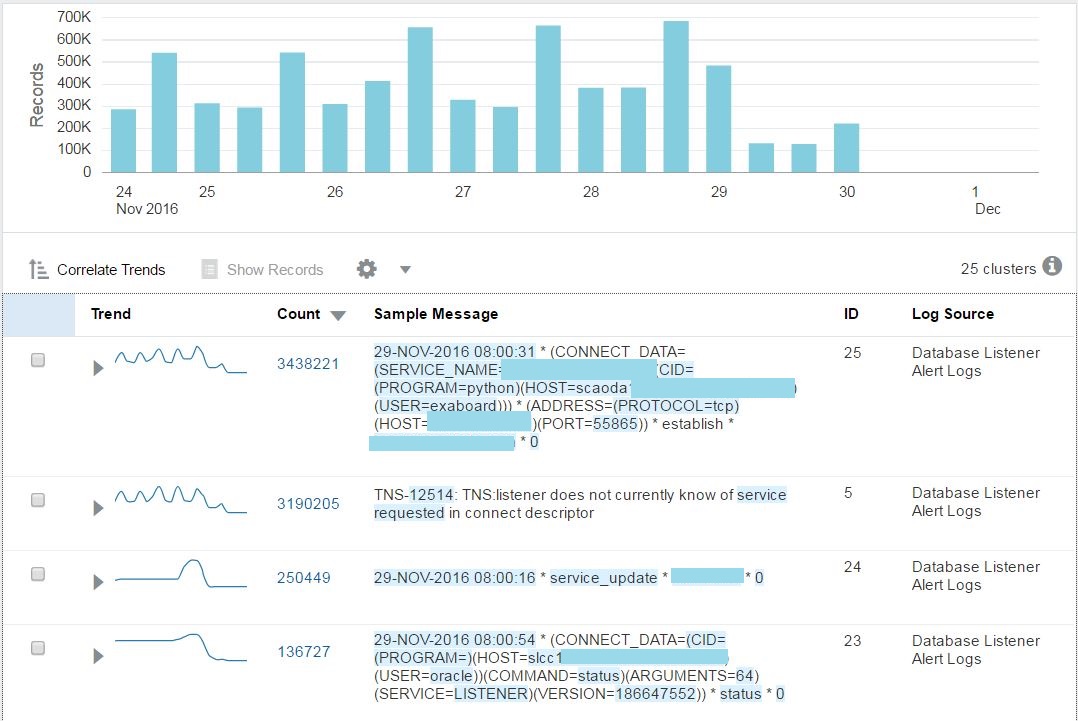
One of my favorite LA features is what I call the needle in the haystack finder, aka clustering. Let’s say we take a look at our Database Listener logs for the last 7 days. Looking at the chart below, you can see we have 7m+ entries.
Now that’s a lot of logs to look through! In fact, I really can’t remember the last time I found anything good in the Listener logs. Always hated those. Wouldn’t it be great if we could see what was clogging up the logs, or if there’s really anything important in there? A lot of time, you’ll see connection errors sporadically and they don’t mean anything. But how do you know if they are safe to ignore or if they’re repeating frequently?
I’m going to use the Cluster command to show OMCs powerful machine learning. I can do that by just adding |cluster to the search string, or selecting Cluster from the Visualize dropdown. Now I see that my 7 million entries comprises of 25 unique message signatures. This is much easier to digest and identify problems. You see that the top error in this case is TNS-12514 error, and it happens to coincide (as seen in the Trend chart) with the connection established from the exaboard user. Now I have something to go on. In just a few clicks I’ve found a problem with the service_name being used by this user.
Again, this can be applied to all types of log files. Database, Middleware, Host, Application… just to name a few. I’ve seen customers identify changes to filesystems, invalid user attempts and more with just a few clicks.
Hopefully you’ve enjoyed this quick introduction to Log Analytics. I’ll be back with more details on how to use this in everyday tasks, as well as how to create custom log sources and parsers.
To learn more about Oracle Management Cloud go to https://cloud.oracle.com/management or contact me here.

