A few weeks ago, someone asked on the OTN forums how to alert on some of the JVM metrics such as ‘JVM Threads – Threads Started (since startup)’ using Enterprise Manager 12c (EM). This is one of those few metrics that EM collects, but does not allow custom thresholds. Let’s take a look at the metrics that EM collects on the WebLogic Server target.
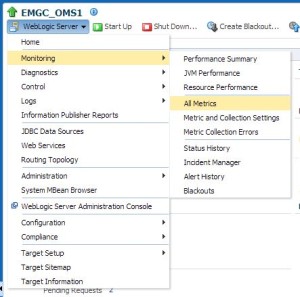
Select WebLogic Server / Monitoring / All Metrics
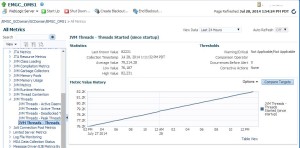
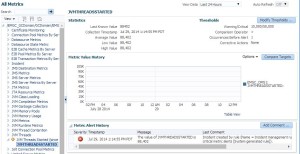
From here we can scroll down to the JVM Threads section and find the real-time data (by click on the category JVM Threads). The real-time data is not stored in the EM repository. Let’s continue to drill down by clicking on the specific metric, JVM Threads – Threads Started in this case.
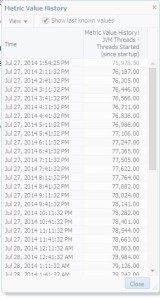
This shows us the data as of the last collection, the chart shows the history, and if you click on the link Table Data you’ll get a nice chart with timestamps and values.
Now let’s take a look at the Metric & Collection Settings page to see what the thresholds are set at.
Select WebLogic Server / Monitoring / Metric & Collection Settings
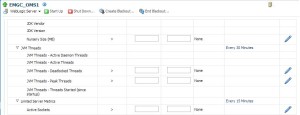
On the Metrics tab, click the view drop down and select All Metrics, and scroll to the JVM Threads section.
As you can see there’s no threshold setting for JVM Threads – Threads Started (since startup). In fact, you can not add a threshold to this particular metric. Why not? Who knows. But that’s not going to stop us.
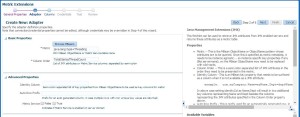
At the time I the only option was to create a Metric Extension to collect this data from the JVM and then store it as a metric and set your thresholds. I referred to one of my previous blog posts showing how to create a Metric Extension on Fast Recovery Area. With the release of EM 12.1.0.4 you can now create a Repository-side Metric Extension to alert on the already collected data! This Metric Extension uses a query to pull data from the repository, and then you can manipulate that as needed. No more re-collecting data just to trigger an alert!
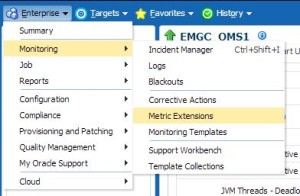
Select Enterprise / Monitoring / Metric Extensions
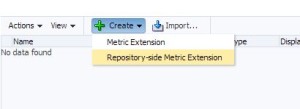
On the Metric Extensions page, select Create / Repository-side Metric Extension.
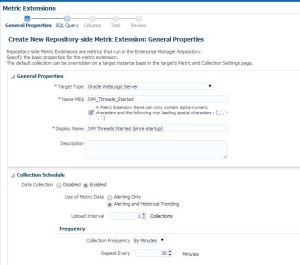
Select the target type, in this case we select Oracle WebLogic Server. Enter a metric name, display name. and adjust collection schedule. Since our metric we’re going to use is collected every 30 minutes, we’ll use that schedule as well. Click Next.
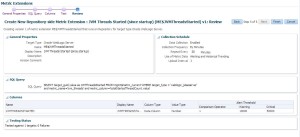
Next you will enter the SQL to obtain the metric. This is where your EM Repository skills will be put to the test. The following query will find the current (last collected) metric information for the WebLogic Server target type and the specific metric we are interested in. Be sure to read the tips and examples on the right side for more detailed queries.
SELECT target_guid,value as JVMThreadsStarted
 FROM   mgmt$metric_current
 WHERE  target_type = 'weblogic_j2eeserver'
 and metric_name='jvm_threads'
 and metric_column='totalStartedThreadCount.value'
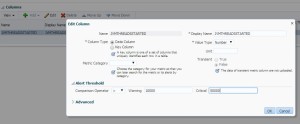
Click Validate SQL to verify, and click Next. EM will pre-populate the required columns based on the query you provided. If you select the row JVMThreadsStarted and click Edit, you can now set a category or set default thresholds. This particular metric may not be a good example for default thresholds as it could be very target specific. In this example, we will go ahead and set the defaults. If you don’t set thresholds here, you can add them at the target level. After editing click OK and then click Next.
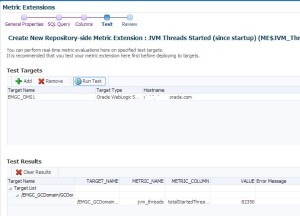
Next we have the chance to Test our metric against a selected target. Click Add, select a WebLogic Server, and click OK. Then click Run Test. You will then see in the bottom pane, the results of your metric test.
Verify that your results are as expected, and click Next . You’ll be presented with a Review screen before clicking Finish to complete your Metric Extension.
Once created, select your Metric and click Actions / Save as Deployable Draft. Then select Actions / Deploy to Targets and select a test target or two that you can deploy to. Once you’ve tested successfully, select Actions / Publish Metric Extension and start adding your metric to templates.
By going back to the Oracle WebLogic Server target I deployed to, and viewing Monitoring / All Metrics, I can now see my Metric Extension and that it’s already generated a Critical threshold violation. Be patient, it may take a few minutes to update the status once metric is deployed.
If you’re not on 12.1.0.4 yet, you’ll need to create a Metric Extension and select target type Oracle WebLogic Server, and use a Mbean browser to find the metric you’re interested in. In this case, the Metric = java.lang:type=Threading and the Column Order = TotalStartedThreadCount.
For more details on using Metric Extensions and their life cycle, see the Enterprise Manager Cloud Control Administration Guide section on Using Metric Extensions.
