Enterprise Manager is a critical tool for monitoring database and middleware targets, as well as Engineered Systems and hosts. Each target has it’s own set of metrics. If you read my previous posts on viewing metrics and setting thresholds, you’ve got a good understanding of how to set thresholds on a single target. What if you have 100 targets? Or a 1000? Your targets for production may even have different thresholds then non-production. Do you really want to manually set these metrics up on all targets? Not likely. If you have more than 3 databases or targets, you should probably consider standardizing your monitoring by using Monitoring Templates. Templates allow you to reuse the metrics you’ve defined for like targets.
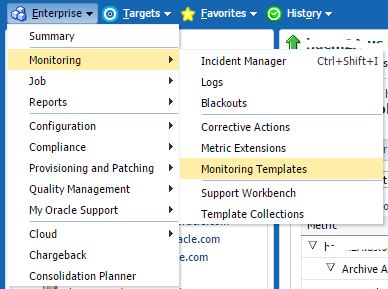
From Enterprise menu, select Monitoring / Monitoring Templates.
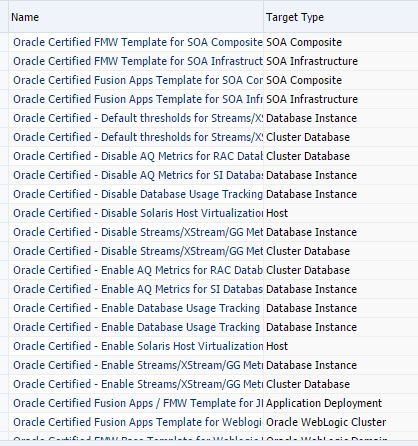
You can see in the search box, you can display Oracle Certified templates. 
If you check this, you’ll find a long list of templates for various midddleware and application situations.
Create Template from Target
The first method to create a template is based on an existing target. This allows you to configure your monitoring on one sample target, and copy this to a template.
Click Create. Notice the copy monitoring settings from Target is selected.
Click the search icon to find the sample target you want to copy metrics from and click Select.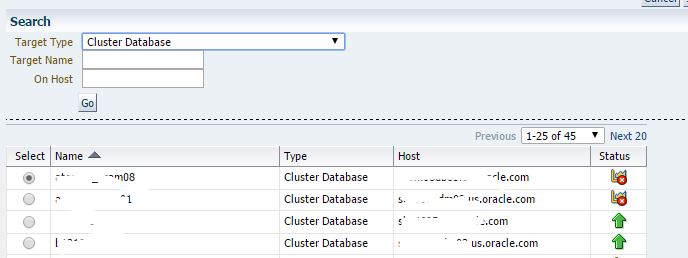
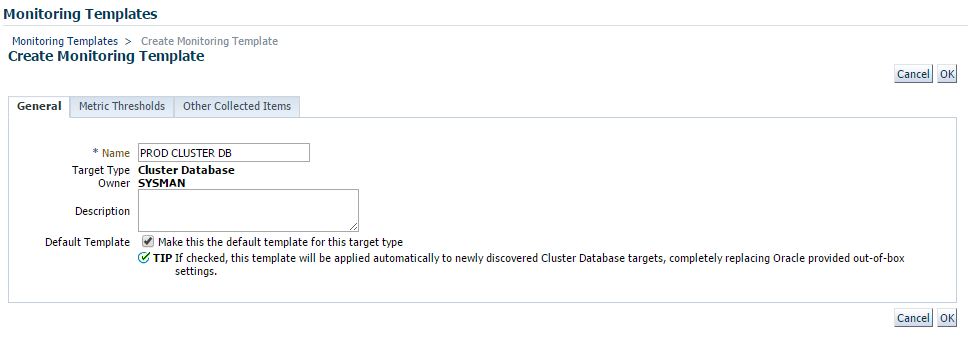
First we need to give our template a name. If you’re going to have multiple templates, it’s best to give them a detailed name to make them distinct and easily identified. Notice the Default Template checkbox – if you check this, this template will be automatically applied to all new (not existing) Cluster Database targets as they are discovered in Enterprise Manager. Only one default template per target type can be identified.
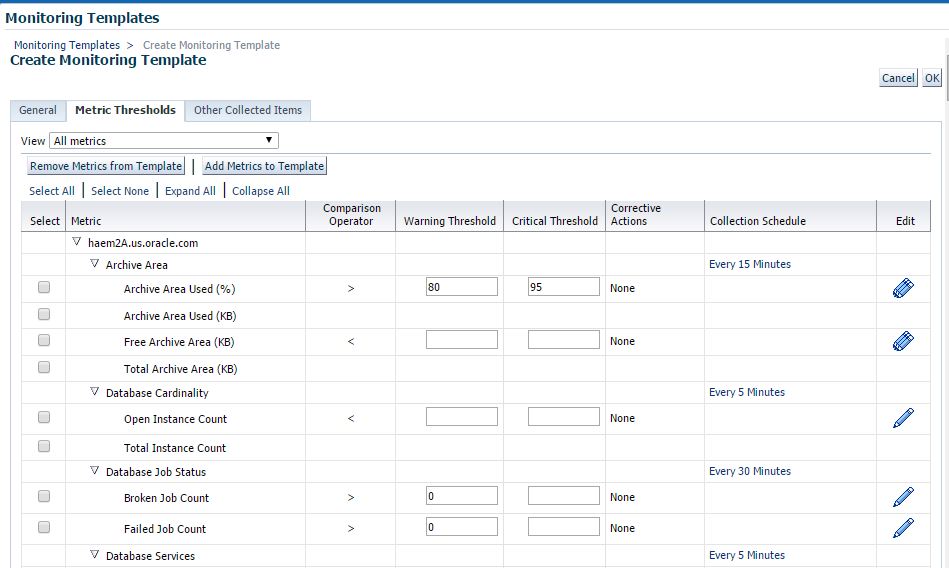
Click on Metric Thresholds and you will see a familiar screen with the target metrics and Warning and Critical thresholds.
If there’s additional metrics you want to add, or maybe remove from this template, click the Remove or Add metrics button.
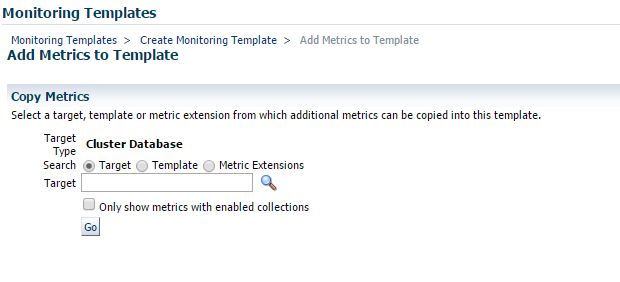
When adding metrics, you’ll be able to search for another target, template or metric extension that you wish to add to this template.
When you’ve made your adjustments, click on the OK button to save your template. You’ll get a confirmation when your template is created. 
Create from Target Type
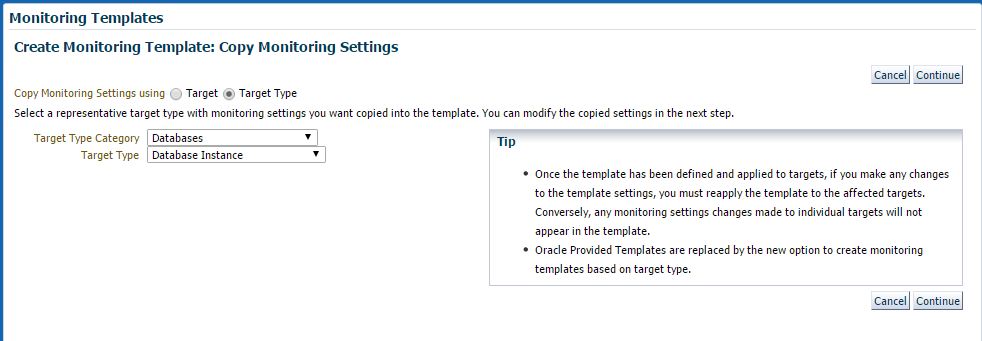
From Monitoring Templates, click Create, this time select the option for Target Type. This option will pull the default registered metrics for that particular target type.
Next you’ll select a category and the target type. For Database, we will select Database Instance. From here, the process is the same. This template will have all default recommended metrics and you can make your adjustments from here.
Apply Templates
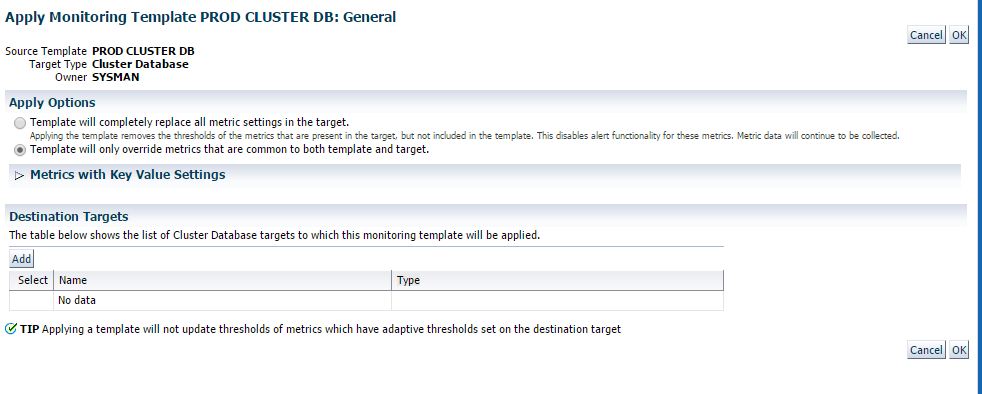
Now that you have a new template, you can select this template and click Apply to apply to any existing targets. 
The Apply Options are important to consider. By default, templates override only metrics common to template and target. This means if there’s a metric on the target, that is not included in the template, it is not removed or replaced. If the metric has different thresholds or no thresholds, then it is updated to match the template. The top option, to completely replace settings on the target will make the target identical to the target. Which means if there are metrics not in the template, the apply will remove thresholds for those metrics and no longer alert.
The Key Values section tells the template apply how you want to handle those metrics such as Tablespace that might have multiple key values, say different thresholds for SYSTEM and SYSAUX tablespaces.
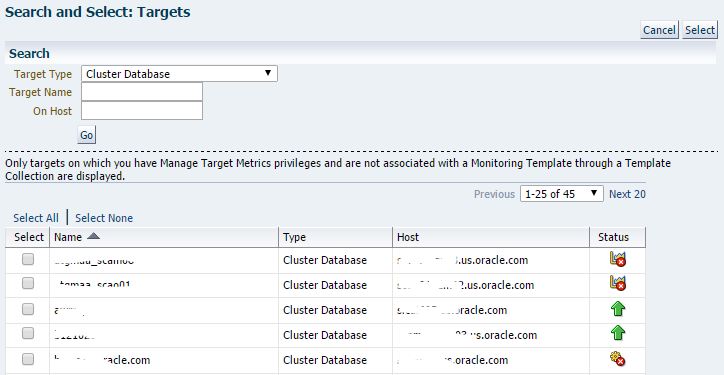
Click Add to select the targets or group you would like to apply the template to, and click Select. Then click OK to submit the Apply job.
You can view the apply status from the Past Apply Operations button and get information on succeeded and failed operations.
So now you can take some time up front, standardize your metrics, and enforce them with templates.
